If you are new to Power BI or if you have not done a lot with it, it can be a little overwhelming to know where to start. In just about every sales deployment, you will have requests from both salespeople and sales managers for ways to get actionable and accurate intel on the performance of individuals and the team.
Of course, you can accomplish quite a lot with the built-in views, charts and dashboards that are available out-of-the-box with Dynamics 365 Sales, but eventually you may find that you run into some limitations. For many years, when considering advanced analytics, the primary recourse was to build an SSRS report – which is still an option. SQL Reporting Services is great, but it can be complex even if you are familiar with the tools and the skills needed to build these types of reports.
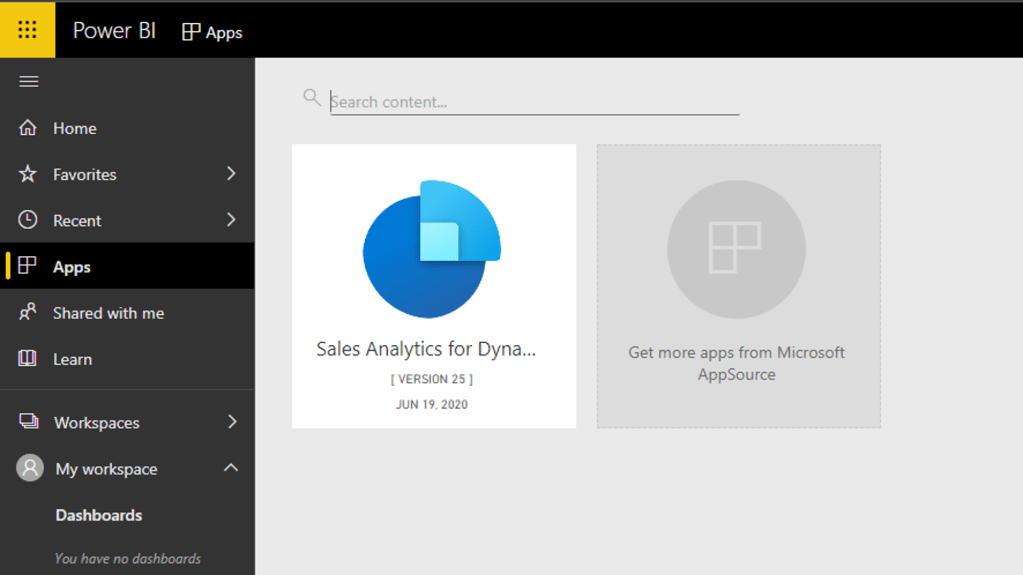
Power BI also requires some skills, of course, but I find it is much easier to get started with. A great place to start is a powerful set of reports and dashboards that Microsoft makes available on AppSource for free (assuming you have the licenses for Power BI), called “Sales Analytics for Dynamics 365 Sales”. Let’s take a look at what this provides, and how you might use this as a starting point in your organization and then build on it.
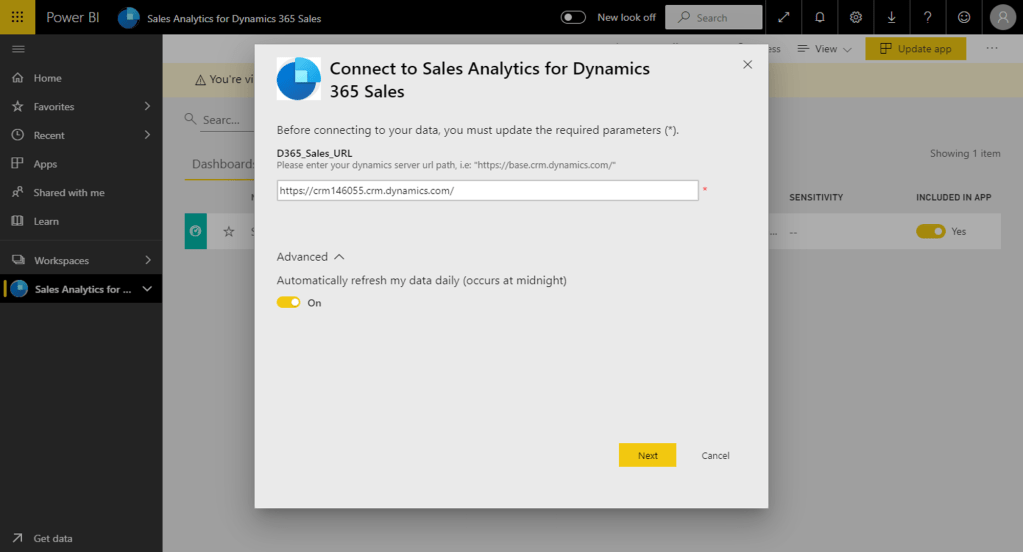
After you install the app from appsource into Power BI, you’ll be prompted to connect by entering the URL of your Dynamics 365 Sales instance. Note the advanced option that allows you to automatically refresh the data – the Advanced area is collapsed by default so it is easy to miss this!
On the next page, you’ll need to authenticate to Dynamics. From the dropdown, choose the OAuth2 method and then the “Organizational” type. This allows you to use your Office 365 login to authenticate from Power BI to Dynamics.

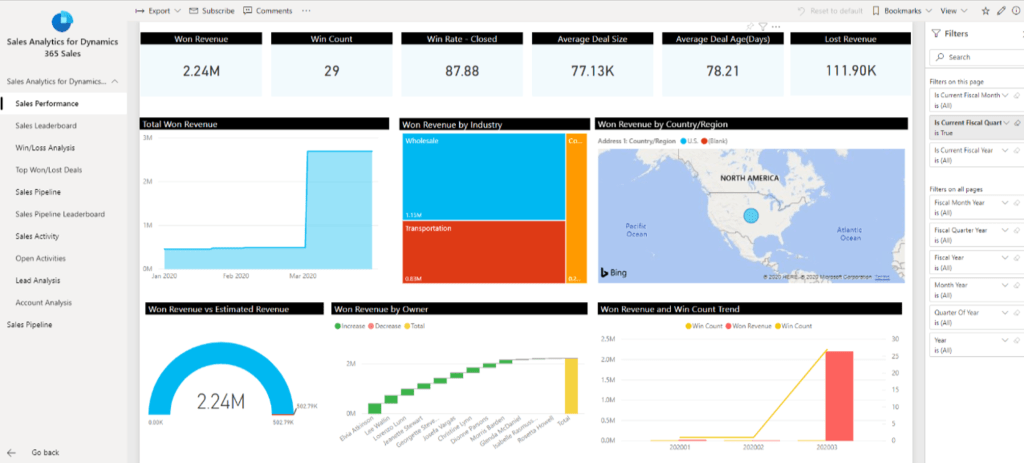
After installing this Power BI app and connecting, your data will be queried and pulled into Power BI. You will have a new workspace that contains a tabbed report. Within the workspace you will find the new dashboard and the reports that make it up. It’s helpful to explore these and the Dataset that is created. If you want to go further into seeing how this was built, you can download Power BI Desktop which provides you with a richer set of tools for designing Power BI reports.
Of course, salespeople and sales managers may not want to log into Power BI and see all of these things, which is why Microsoft has delivered this set of reports as a Power BI app.
Making This Power BI App Available in Dynamics 365
Let’s look at how we can make this available to our sales users without forcing them to leave the Sales app in Dynamics.
First, make sure the report is shared with your Dynamics users. You can either share it directly with individual users, or, as a better alternative, share it with an Office 365 Security Group that contains your Dynamics users.
Next, within Power BI, navigate to the report and click File > Embed. You’ll get two options: a direct link to the app, and iframe code you can use in your own HTML.
Option 1: Add a link to the Sales app’s sitemap to open a new tab for the Power BI app
One simple method to add this to Dynamics is to edit the “Sales Hub” app and modify the sitemap to add a direct link to this dashboard. It will open a new tab for users directly to the Power BI dashboard.
In the Power Apps maker portal (make.powerapps.com) find the Sales Hub solution and double-click the Sitemap to edit it. Add a Subarea and set the “Type” as URL. Then simply paste in the URL from the Power BI embedding options:
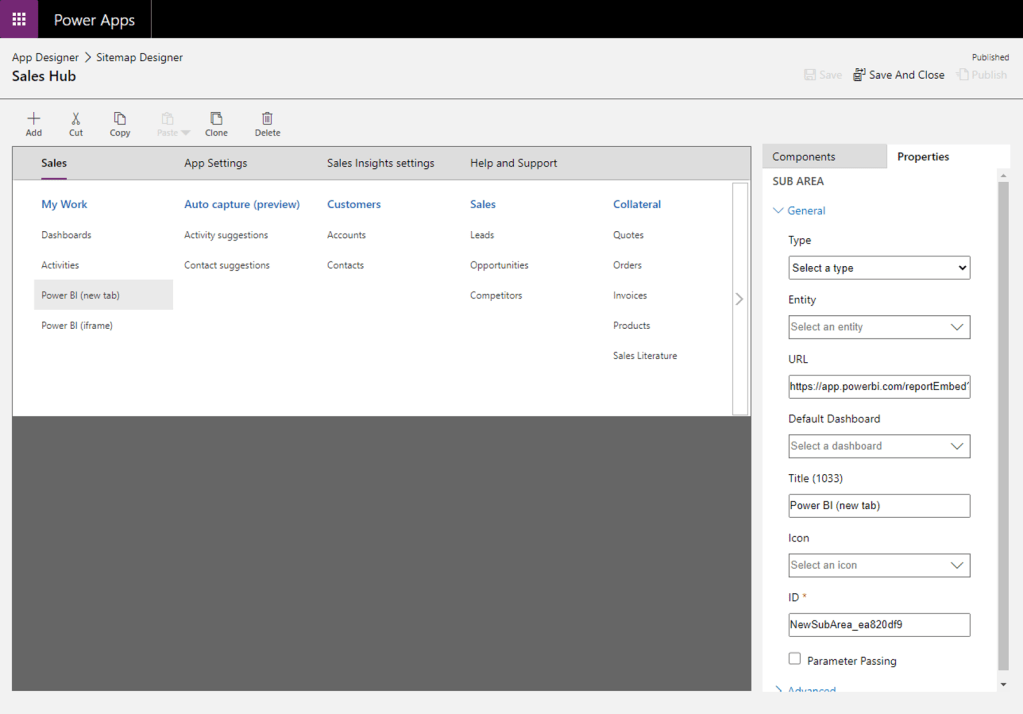
Publish your changes, and you will have a new sitemap in the Sales Hub app with a link to the Power BI app. It will open it in a new tab or browser window for your users.
Option 2: Add a Web Resource to the Sitemap
I like this option better, but it takes slightly more effort. First, in the Power Apps maker portal, create a new Web Resource. Select the type as “HTML”. You’ll need to add the HTML for the opening and closing <html> and <body> tags. Then simply paste in the iframe code from the Power BI embedding option:

TIP: Change the width and height of the iframe to 100% so that the Power BI takes up the entire frame within Dynamics.
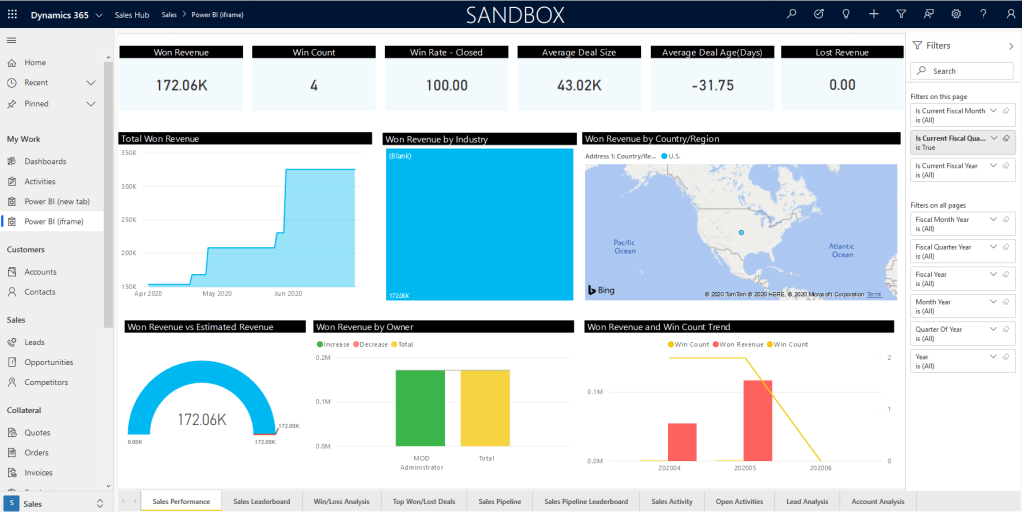
The result is a rich set of dashboards, charts, and analytics, easily accessible to your Dynamics Sales users:
Hope you find this helpful! From here, you can begin to build on the out-of-the-box Power BI by adding your own reports, charts and analytics, leveraging the dataset the app has created for you in Power BI.
