Microsoft Partners: Why you need to get smart about Customer Insights. Right now!

With the 2019 Wave 2 release rolling out from the Microsoft Business Applications Group and all of the surrounding fanfare of announcements and updates, and with Microsoft Ignite coming to a close this week, partners in the Dynamics/Power Platform space have a lot to digest this month. Let me take this moment to help you sort through and prioritize what you decide to focus on with your teams over the coming month or two. Not surprisingly, I’d like to suggest that you put Customer Insights at the top of your list. Let me explain.

One word: Salesforce.

It is no secret that the Microsoft Dynamics 365 product team has been taking direct aim at salesforce.com for years. What might be less-appreciated outside of our industry is just how successful Microsoft has been in this competition. In years past, industry observers might have been justified in saying that salesforce.com was the innovator and leader in the business applications/CRM space, and Microsoft was regularly seen to be the late mover or also-ran, bringing technologies to market often years after salesforce.com had introduced them to their audience. Salesforce.com was the first mover in the SaaS CRM market, at least at scale, around the beginning of the millennium. It would be 8 years before Microsoft was able to launch Microsoft CRM Online, and then only in North America. And think about marketing automation: salesforce.com purchased ExactTarget and created their Marketing Cloud years before Microsoft introduced their own marketing application. Think about AppExchange vs AppSource, Trailhead vs. Microsoft Learn, Lightning vs. Unified Interface. The list could go painfully on.

But.

But Microsoft has been rapidly closing the gap and transforming its ecosystem of business applications in a way that could potentially leapfrog salesforce.com. To this observer, perhaps the first and most significant sign of this change of leadership is Microsoft’s entry into the CDP, or Customer Data Platform, space, with the launch this past April of Customer Insights.

The Background

To understand why this is so significant, you have to consider the bigger picture of the CRM and martech space over the last two decades. Back in the previous century, these technologies were the domain of only the largest enterprises. With the rise of SaaS, they became more accessible. Today, as we approach the third decade of this new century, they are table stakes for every business bigger than a mom-and-pop storefront. The affordability and power of CRM and marketing automation means that these technologies are almost ubiquitous, and not having strategies around them almost certainly puts a business at a huge competitive disadvantage.

The promise of these technologies was to help companies to scale their processes – whether sales, service or marketing – to larger and larger audiences of prospects and customers. But at the same time as businesses have been scaling their reach through the use of CRM and martech, a revolution has taken place amongst consumers. Starting with B2C consumers, the purchasing process and decision-making process has become something that is largely completed without the direct input of the business that is trying to sell to them using their highly-scaled CRM and marketing tools. This revolution has been driven by the adoption of smart phones, social media, and ubiquitous internet access. And it has also translated to the B2B space. Business buyers are also individual consumers, and they have taken their shopping habits to work with them. They now conduct their research and get to the point of a purchase decision often well before the seller even knows who they are.

In other words, we may have reached a point where CRM and older martech has scaled a business’s reach as far as it can scale – diminishing returns at best.

The goal of businesses now must be to flip the story on its head: approach their selling and marketing processes from a starting point of the customer. It’s not sufficient any longer to be able to build a subscriber list that you can target with your monthly newsletter. That may well be a necessary ingredient, but it is hardly a sufficient one if the goal is to reach this revolutionary new consumer. In marketing terms, the mandate now must be that businesses adjust their sales and marketing processes around their customer, around a “segment of one,” instead of simply around how they want to improve their processes internally.

That is why over the last few years, savvy marketers have begun to embrace the emerging tech of Customer Data Platforms, CDPs. CDPs are designed to deliver on the promise that CRM once had: get to know your customer at an individual level so they might be more inclined to let you join their buying process.

Why This is Important to Microsoft Partners Now

The reason all of this is so important and timely if you are a Microsoft partner with a focus on traditional CRM (and of course, nowadays, Power Apps and the rest of the Power Platform), is because salesforce.com announced earlier this year that they would be jumping with both feet into the CDP space. After talking CDP down in previous years, they announced at Dreamforce that they would launch a pilot of their Customer 360 CDP application in November 2019, and plan to make it generally available in the beginning of 2020. But there is another “but” to this story: Salesforce’s CEO for marketing, Bob Stutz, departed the company to head back to SAP. (Yes, the very same Bob Stutz who had previously been at Microsoft running Business Applications and buying up a number of not-so-memorable applications like Marketing Pilot.) Salesforce.com announced a new head of their marketing group just last week, and he will be coming into the role at the very same time they are supposed to be launching their CDP pilot.

I see that as an opening for Microsoft and its partners to gain even more ground with Customer Insights before salesforce’s new marketing CEO has a chance to get his feet under him. And marketers are exactly who you should be selling to if you are a Dynamics/Power Platform partner who cut their teeth on CRM.

So where to start?

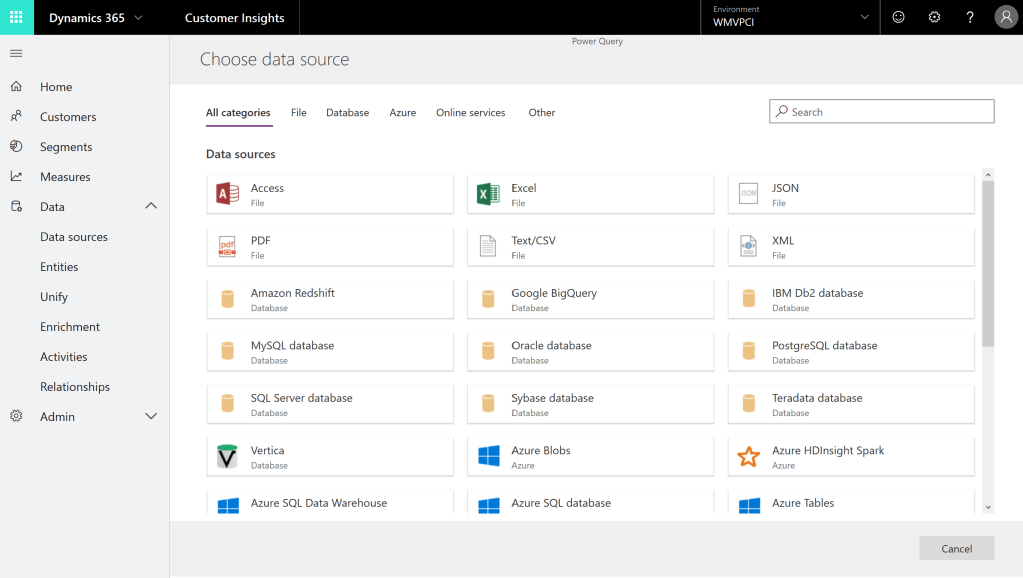
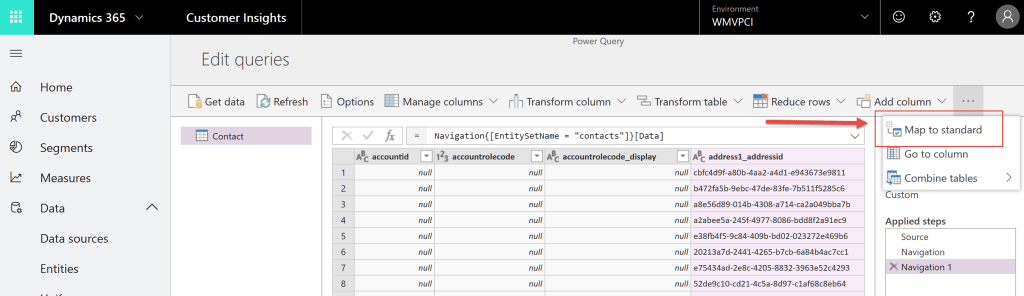
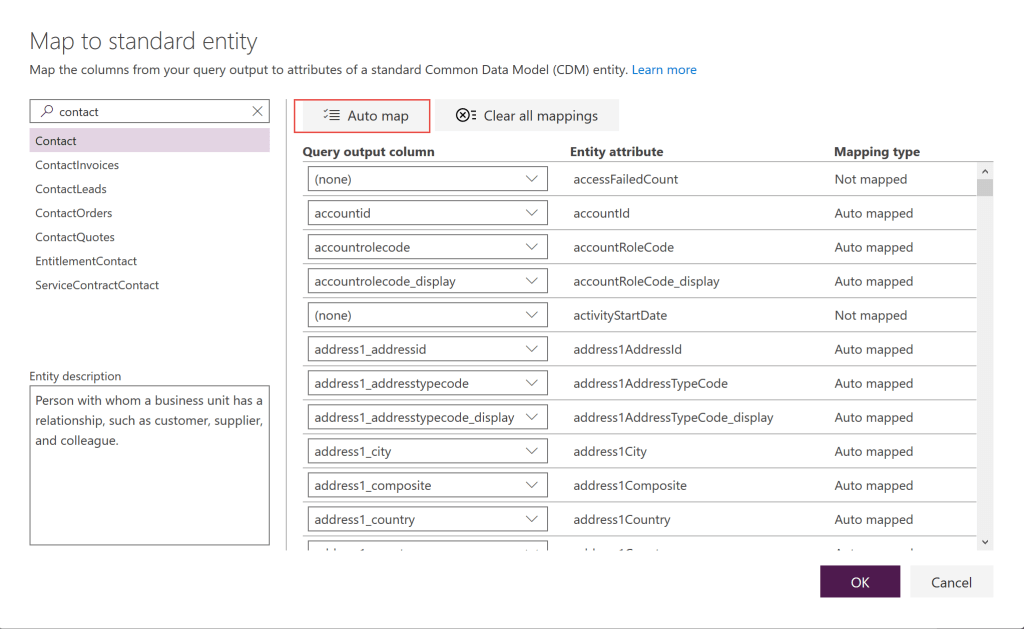
Start on Microsoft’s site to watch the many videos and read the blogs they’ve posted. Set up a trial and kick the tires. Look for a “Customer Insights in a Day” workshop that is likely taking place near you soon (check the team blog for the latest). If you missed Microsoft Ignite, you can watch a lot of the sessions on-demand now. Make this your top priority!

Use Power BI to Collect Unstructured Data from the Web

Follow the steps in this article to learn how to scrape data from websites, structure it in tables, and use it in a Power BI report. In this example, I show how to create a Power BI calendar of events that draws data from two publicly accessible websites.

This is one of my favorite ways to use Power BI and I’m always surprised at how few people are aware of this amazing capability. You can see an example of this at my other site: https://www.d365calendar.com/about/powerbi-calendar/

First, set up Power BI Desktop

Download Power BI Desktop (not to be confused with Power BI Report Builder, which is the new name for the tool used to build SQL Server Reporting Services Reports and creates RDL files). To download Power BI Desktop, go to powerbi.microsoft.com and click on the Products menu, or open the Windows Store on your machine.

Second, get the data
  1. Click on “Get Data” > Web
  2. In the “From Web” dialog, select “Basic” and enter the URL. I’m pulling data from the D365 User Group’s list of events on their website: https://www.d365ug.com/events/calendar
  3. After connecting, click the button “Add Table Using Examples”
  4. This shows you a preview of the web page where you can begin to select information to place in columns to build a table:
  5. Place your cursor in the first row and begin typing the text that represents an example of the information you want to capture in that column:
  6. You can type a couple of examples if necessary to make sure the Power BI is grabbing the correct info. Tab away and it will fill in the rest of the column.
  7. Rename the column. I like to use a convention that describes the source of the information.
  8. Then tab to create the second column and repeat the step for the next bit of information. Sometimes the webpage will not have the data broken out in a way that makes it easy to parse just the bits that you want. In this example, I just want the date, but I’m getting a long string with the word “When”, a colon and a bunch of empty spaces.
  9. Once you have selected the raw data from the website that you want for your table, click OK.

Tip: You can take a look at the webpage that you are using as a datasource in a browser and use the browser tools to see which elements of the page might be parseable by Power BI. Power BI will look for CSS IDs and selectors to distinguish the elements that make up the page:

Next, Transform your Data
  1. Back on the Navigator screen, click “Transform Data”:
  2. In the Transform window, I am going to use some transformations to get the data I am interested in. For this first column, I will Split the string by the positions of the characters in the string:
  3. When I do that, Power BI looks at the string and automatically shows me where each part of the string starts:

    So if we look at that information, we can see that position 0 must be where the word “When:” starts, and position 104 must be where the date starts. 108 must be the day, 111 must be the year, and so on. I don’t want to break the date out into its sub-parts, so I am going to just split it at positions 0 and 104:
  4. This gives me a new column that just starts at position 104:
    Tip: If I need to undo a step because I mess something up, I can delete it on the right:
  5. Next, I want to just get the date out of my new column. I am going to Split the new column by a delimiter. I don’t want the stuff that starts with the word “from” so I can use that word as a custom delimiter:
  6. Check out what happened here, automatically. After I split that column out, Power BI automatically recognized that this data is a Date type. I can tell by the icon at the top of the new column:
  7. I do a similar “Split by Position” to parse out the location and rename that column. It took some trial and error to find the exact position that the location starts. It turned out that I wanted to split by positions 0 and 117. Then I renamed the column to D365UG_Location:
  8. When I’m satisfied with my table, I click on “Close and Apply”:
Rinse and Repeat

I want to combine this data with another data source, so let’s try another web page. I will repeat the above process with data from https://www.365portal.org/events/.

Now I have two tables with data I can use in my report.

I can continue to add more in the same manner, or even connecting to other types of data. I’ve also gone ahead and connected some data from CDS.

Normalize

Before I proceed, I am actually going to rename the columns so that across the three different data sources, they are uniform for Name, Date and Location. That will let me use another feature of Power BI to create a new table that combines all the data I scraped from the websites and pulled in from CDS.

  1. I want to combine these different data sources into one new table. So in the Power Query editor, I click on “Append > Append as New” and select the three source tables:
  2. This creates a new table for me that has all the columns from all of my data sources. I have removed the columns that I am not interested in for the next step, so all I am left with is Name, Date and Location. I have also renamed this new table to “Combined”:
  3. Click “Close and Apply” again
Design your report
  1. Now I can begin to design what I want this to look like. I want to add a new control to display this data, so I am going to import it from the Power BI marketplace:
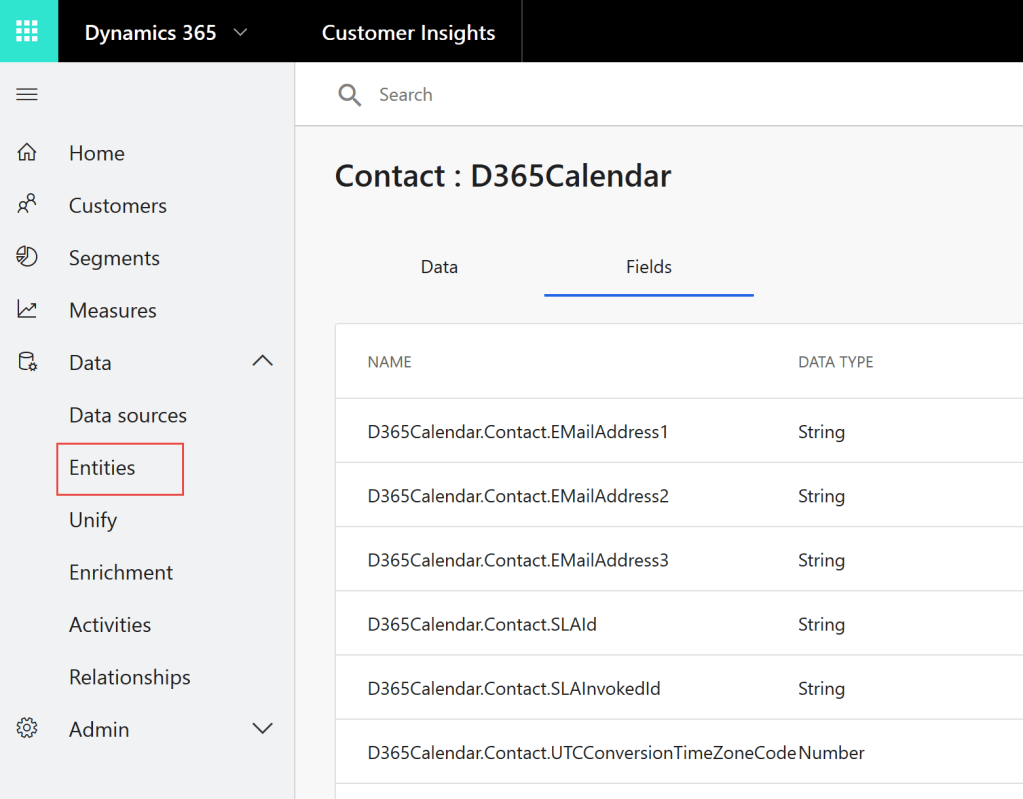
    I’ve opted to use the MAQ Calendar since it has a decent layout and navigation to see the calendar by day, week or month.
  2. Lastly, I am going to embed this on a portal using a simple iframe:
  3. On my portal website, d365calendar.com, (which runs on Microsoft’s Power Portals by the way!) I’ve added a page and in the HTML, I paste the iframe code from Power BI:
  4. And here is what it looks like live on the site:

These are some of my favorite tricks with Power BI, and I hope you’ll enjoy using them now as well. Leave a comment below and tell me what you think!

Measures: Extracting Insights from Customer Insights

A continuation of a series of posts diving into Customer Insights

Looking at a Customer Card or the home screen dashboard in Customer Insights, one of the first things you’ll notice are the tiles that display various numbers, or measures, representing a customer’s interactions with your company. These might include things like a customer’s average purchase when visiting one of your bricks-and-mortar retail establishments, their average online purchase, or lifetime value.

Types of Measures

There are several different types of measures:

  • Customer Attribute – Configuring this type of measure allows you to add a new attribute for display on the merged contact. For example, if you wish to combine all of an individual contact’s purchases from across various systems into one field to show the individual’s total spend.
  • Customer Measure – Similar to the customer attribute above, but with an added dimension like time. For example, if you wish to show how many times on average a customer visits your online store, or how much do they spend across all your systems on average per month.
  • Business Measure – A business measure is a way to look across your entire customer base in aggregate to answer questions at the business level rather than at the individual contact level. This is the type of measure you would configure to answer questions like “what is the average purchase at our retail/POS locations?”
Variables

Variables are operations that you want to perform for each customer record in Customer Insights. One of the more interesting capabilities you’ll come across when building a measure is the Variable Expression editor. It is not intuitive at first. On the right, it will show you the tables and attributes from your connected data that you have chosen as you begin building out your measure. I’ve found that if you click the attribute on the right, it will put it in the expression editor for you, saving you from having to figure out the correct syntax to use if you were to type it in manually.

Double-click the attributes on the right to get them into the Expression area.

After clicking one of the attributes on the right to put it into the Expression area in the correct syntax, you can simply type the mathematical operator you want to use. You can also group operands using parentheses in order to perform more complex operations. For example, you might want to create an expression like “(Total Web Purchases + Total Store Purchases) / RewardsPoints” to determine how many dollars your customer had to spend across both your website and bricks-and-mortar stores to earn each reward point they’ve been granted. (Perhaps your letting some customers earn those valuable loyalty points too cheaply because they’ve figured out how to game your loyalty system!). That expression would look like this:

(eCommerce_eCommercePurchases.TotalPrice + PoS_posPurchases.TotalPrice) / PoS_posPurchases.RewardPointsAdded
Functions

After creating a variable for each unified customer record, you’ll need to apply a function to it. Do you want to look at the average result of your variable operation across your entire customer base? Or a sum or count of those results? That is defined in the Function.

Note: A function creates fields where the results of your measure are stored. Behind the scenes, when you define a measure you are creating a new “entity” that will be listed in the Data area of Customer Insights. If you open that entity, you can also view the fields that were created for it as a result of defining the function.

Creating measures can take some experimentation – it’s worth it to begin exploring your data and playing around to see what types of insights these measures can provide your organization. It’s very likely you’ll uncover some things that weren’t obvious before your customer data was nicely unified.

Customer Cards in Customer Insights

This post is part of an ongoing series on Microsoft Dynamics 365 Customer Insights. Check my blog feed for previous posts on this topic!

After you have connected and unified your data, you can begin to build your customer card and enrich the customer profile using built-in functionality. Let’s take a look at how to do this.

Enrich your Customer Card

Enriching the customer profile takes advantage of data from Microsoft’s Graph, which is basically hundreds of millions of data points that Microsoft has collected and categorized about consumer behavior by three facets: age, gender and location (based on the customer’s postal code). Currently the Graph data set that is available in Customer Insights only covers the United States.

The idea behind enriching your customer profile is to compare your existing customers with the interests and brand affinities of people who are similar to them, based on age, gender and location. For marketers, this is invaluable and very difficult and costly to do with their own data.

Imagine if you are a marketer at a consumer retail business with 10,000 customers: Wouldn’t it be great to be able to look at your customer base and have some idea of how much each customer might like a particular brand (perhaps a competitor’s brand, or one that is similar to your own)? Or if your customer is interested in outdoor sports or fine wine? How would you begin to go about that? There are data sets available online, but you would have to try to slice and dice your own data so that corresponds to the available market study data that is available, and you would of course have to purchase that data. There’s also a good chance that the data you purchase is out of date. But in Customer Insights, Microsoft handles this problem for you with Microsoft Graph.

The first step is to select two of the three facets to compare to your customer data:

How do you want to compare your customers to the Microsoft Graph?

In this example, we are looking at our customers based on age and location. Next, we have the option to choose the brands and categories that our customers are likely to have an interest in. We can choose from any of the thousands of brands that the Microsoft Graph data set already contains, or we can let Microsoft choose for us by selecting our industry:

Which brands and interest categories are relevant to your customers?

After selecting these parameters, click the Run button at the top, and CI will begin to compare your customer data with the Microsoft Graph data. When it is done, you will see how many customer profiles have been enriched.

Building the Customer Card

If you are following along with previous posts, you’ll already have done the first step in building your Customer Card, which is the “Merge” step of data unification, where you would have selected the fields from your different data sources that you want on the card.

Navigate to the Customers area of CI. Before viewing your Customer Cards, you will be prompted to specify which fields will be used to index your customers so you can search and filter the views:

Choose which fields on the customer profile will be searchable

This process is a quick, wizard-driven step, and, once completed, you will automatically be taken to the view of your customer profiles:

Customer profiles are represented as “cards” in Customer Insights

The fields displayed on the Customer Cards are the ones that we specified in the “Merge” step of our data unification. The great thing here is that I may know that we have more reliable birthdate information in our ERP system, but more up-to-date phone numbers in our CRM or loyalty system. Since I defined which field would be the “winner” during the Merge step in case more than one data source has the same information, the Customer Cards show me the most reliable and complete data for each field.

Drilling into each card lets me look at the particular individual, where I can see the fields I have chosen for the merged Contact, their average purchases (or whatever other measures I have configured), and the brands and interests they might enjoy based on their age/location. If you have also connected a data source that represents activities like phone calls, website visits, or emails, the timeline will show you this as well.

The completed Customer Card
Up Next

Continue to follow this blog series for more on Microsoft Dynamics 365 Customer Insights and other Dynamics technologies. In the coming weeks we’ll have a look at how to build measures in Customer Insights, manage your connected data, build segments, and more. Leave a comment with your questions, ideas and your own tips!

Unify Your Data in Customer Insights

Follow this series to explore Dynamics 365 Customer Insights.
For an overview of Customer Insights, read the first post in the series here. The second post covers the topic of getting started and connecting your data to CI and can be found here.

After bringing in your data and making sure that the types of data have been correctly categorized, the next step is to unify all your data sources. To do this, you need to tell Customer Insights what represents a customer across different systems, how they might be matched up, and then create a “merged” customer profile from your source data. Unifying your data consists of three steps:

  • Map – Map your ingested data to a common model (CDS entity, for example)
  • Match – Determine what consists of a match from one data source to another
  • Merge – Create a unified “customer” entity for use in CI
Map

Let’s consider a scenario where we have brought in data from four different data sources. Two of them have the idea of a contact – one is an eCommerce system that has a Contact entity, and the other is a Loyalty Card tracking system which refers to them as customers. The other two data sources have data about purchases and activities.

I want to determine how many unique people we interact with across the two systems that have data that represents people, and find out how many of them are in both systems. Then I will use that data to understand them more deeply.

I’ll start by going to “Map” under the Unify area and select the two tables that represent people:

Select the tables from your ingested data that represent people or customers.

Mapping at this point is a simple exercise. The system is intelligent enough to make some assumptions about the data types that have been brought over. For example, it will automatically assign model types to the DateOfBirth field of Person.BirthDate and the PostCode field is identified as a Location.PostalCode type. The main thing I need to do is to let CI know which field from each source represents the primary key:

Setting the primary key for the customer tables
Match

In the matching step, start with the data source that represents the most complete and accurate representation of your customers. In this example, our eCommerce system has the most customer information, and the loyalty program data source is more of a subset. We’ll include all the records from both systems so we have a union of both data sources to work with.

Matching starts by selecting the data source that has the most complete info about customers

If you have a third or fourth dataset that represents customers/contacts, you can add these. CI will first check for matches between the Primary table and Entity2 and come up with a list of matches. It will then take that list and check for matches in Entity 3. From the resulting list it will then check for further matches in Entity 4, and so on.

After establishing that hierarchy, we want to specify a rule to match each customer that appears in both systems. You can match based on one or more conditions. For example, we want to look at the full name and email across both systems to find matches. You have some options for each condition:

  • Precision: Exact will only match precise matches, high/medium/low give you increasing levels of fuzzy matches. If you are going to create a segment for a marketing list, you might choose a lower match precision where customer records from the two systems are matched with a lower level of confidence, but if you are going to run financial analyses, you might choose a higher precision.
  • Normalize: The normalize option can be used to ignore whitespace, capitalization, numerals, or to only match if the fields are of the same attribute type
Set up rules that will determine how matches will be made between your data sources

After creating the rule, it will run against your data and you can see a preview of the different matches based on the confidence level that CI has in the match it has determined.

Merge

The last step in unifying your data is to create a “merged” Contact record in CI. The purpose of merging is to create the meta-customer record that you will see in CI and to instruct CI on how to reconcile conflicting matches. This merged contact is represented in CI as a “Customer Card”, also referred to as a profile. A merged attribute is an attribute that exists in more than one data source and represents the same piece of data. For example, both of our data sources have a FirstName attribute, but the rank shows that we will give preference to the FirstName field from our eCommerce data source in case they differ.

Merged fields from different data sources can be ranked to determine which source is the “truth” for that field.
Next up

The end result of mapping, matching and merging will be a Customer Card representing each person’s profile in Customer Insights. In the next article, we’ll take a look at the Customer Cards and some of the other ways you can configure Customer Insights to gain deeper understanding of your customers.

Getting Started with Customer Insights

Follow this series to explore Dynamics 365 Customer Insights. For an overview of Customer Insights, read my previous post here.

Customer Insights (CI) allows organizations to consolidate data from disparate sources in order to build a unified customer profile. It also applies pre-built AI models to help with matching customers across those data sources, and can provide views of business and individual customer health.

To try CI, start a trial here. Note that if you scroll down on that page, you can get started right away and provision an instance of CI within minutes. Your trial will include a demo environment that is pre-populated with sample data, as well as an empty environment where you can begin working with your own data.

Once your trial is provisioned, the first step will be to set up your data. CI includes a number of data connectors that allow you to easily configure CI to ingest CSV files, SQL data, and even data from your Customer Engagement or CDS instances. (See the documentation here for steps on connecting your data.)

Customer Insights comes with a variety of data connectors

Connecting to many sources simply requires entering a URL and your credentials. In the future, it will be possible to configure a data gateway to connect to on-premises data sources, but the easiest and quickest to work with are obviously the online sources, whether it is CDS, a file stored in an Azure blob, or another online provider. Once connected, CI uses Microsoft’s Power Query to allow you to select and manipulate the data before loading it into CI.

If your data source has more than one table, you can choose it from this screen.

After selecting your table(s), you have all the tools of Power Query at your disposal to manipulate the data. For example, if you are connecting to a CSV, you can set the first row as the column headers, or change the data types.

CSVs

If you have connected to a CSV, make sure to set the data types for each column since they will be brought in as simple Text type columns by default.

You will need to set up at least two data sources before you can move on to the the “Unify” steps to map, match and merge your data.

Be careful! Once you have done some mapping and matching in the Unify area of CI, it becomes very difficult to edit or remove a data source because of all the inter-dependencies that will will have been created.

CDS Entities

Since CI is part of the Dynamics 365 family, it understands the Common Data Model entities that live in CDS/Customer Engagement natively. This means that even before you leave Power Query, you can map the chosen CDS entity from your source, automatically letting CI set the column types for you. For example, if you are bringing in the Contact entity, use the “Map to Standard” button at the top of Power Query to let CI know that this is the same Contact entity that exists in the Common Data Model.

Entities

After your data has been ingested by CI, each table will create an “entity” in the Customer Insights system. If you are familiar with Customer Engagement customization, this entity is similar in concept. It is basically the description of the fields and field types that you have connected, and provides a preview of the data that was ingested.

Make sure you are completely satisfied with your data sources before you move to the Unify steps. You might be tempted to go straight into the Map/Match/Merge process to begin unifying your data. Be careful! Once you have done some mapping and matching in the Unify area of CI, it becomes very difficult to edit or remove a data source because of all the inter-dependencies that will will have been created.

Up Next… Unify Your Data!

Stay tuned to this blog for the next entry on unifying your data, where I will describe for you what is happening under the covers. Unifying is the key step to building your customer profile, so you’ll want to get it right!

Dynamics 365 Customer Insights: CDP + AI = Huge Potential

Microsoft’s Customer Insights promises to democratize the power of artificial intelligence to create a holistic view of the customer.
An example of a customer profile pulling data together from website visits, customer service, CRM, online orders, and retail purchases

If you have not yet heard the term “CDP”, get ready to start hearing it a lot more in your conversations with customers and others in the CRM space. CDP stands for Customer Data Platform, a term that describes the ultimate goal of most customer relationship and marketing platforms: providing a unified, holistic view of your customers, regardless of where information is stored about them and their interactions with your business. Once unified, businesses – and especially marketers – want to use this data to define more accurate segments to target for initiatives like lead acquisition and retention campaigns.

For example, many businesses will have siloes of data that represent customer purchases and payments, website visits and marketing interactions, customer service requests, relationships to other customers and vendors, social profiles, and more.

It is not uncommon for traditional CRM deployments to make a valiant attempt to provide this 360-degree view of the customer through a combination of data migrations, integrations and mashups. But this approach involves a high level of complexity to implement and requires difficult decisions about which system will be the “system of record” for a customer. It also means that data quality issues in each silo and legacy system need to be addressed before a reliable and useful view can be cobbled together. Further complicating this effort, the mapping of customer data between systems is often difficult since each system may have different identifiers like customer numbers, email addresses, and other record IDs.

Enter Dynamics 365 Customer Insights

Microsoft is uniquely positioned to address the challenges that CRM and CDP systems face in presenting a truly unified view of the customer, and launched Customer Insights in 2019 to showcase their unique take on the CDP problem. By using a pre-built AI model, Customer Insights can ingest massive amounts of data from separate systems and leverage fuzzy matching strategies to show total lifetime value, churn risk, and more. The AI behind Customer Insights will automatically make decisions for you about whether Bob J. Anderson, who completed a “Contact Us” form on your website last year is the same person as r.anderson@contoso.com who had a customer service ticket this week about a widget purchased months ago in your brick-and-mortar store using a loyalty card with member ID #003498.

Few other CDP vendors can match Microsoft’s AI capabilities that make smart decisions to pull together customer data from your different sources. And Microsoft also layers on proprietary data to enrich the customer profile.

A dashboard in Customer Insights showing aggregate measures based on data from many different systems

Beyond unifying your disparate profile data, Customer Insights can be configured to automatically enrich it using brand or category keywords, pulling from an enormous stock of Microsoft-proprietary data that consists of sources like social media and web activity. The profile is further enhanced through a timeline of activities drawn from your transactional and relationship systems, so instead of just unified demographic data, you can have a bird’s eye view of the customer’s interactions across your business landscape.

Measures can be defined to give a view of the health of a customer relationship or to score their interactions across platforms. Customer Insights unlocks the ability to create segments or lists of customers based on parameters from any of the connected data sources. Segments can be exported as CSV files so they can be used in, for example, an external marketing application, or directly to an instance of Dynamics 365 Customer Engagement for Sales.

The process of adding new data sources to continually build out the customer profile has been simplified to a point and click approach, eliminating the need for costly, complex and error prone integrations. And the user can schedule periodic refreshes of source data to keep Customer Insights up-to-date.

Customer Insights choosing a data source
Choosing a data source in Customer Insights

In the initial release of Customer Insights, Microsoft provided a pre-built model for profiling individuals, or Contacts, making it a natural fit for B2C scenarios. But their plans for the second release wave of 2019 include expanding this same type of functionality to the company/account level to address the compelling use cases that B2B scenarios present.

Already, Microsoft has provided an integration with their CRM product, Dynamics 365 Customer Engagement (CE), so profile cards can easily be inserted on the Contact form in CE. Extending the functionality of Customer Insights can also be accomplished using a connector for Power Apps and Flow, meaning that changes to the unified customer can easily be incorporated in nearly any business process. And a Power BI connector allows the profile data to be analyzed and visualized in ways that previously would have required massive enterprise-wide reporting efforts.

Conclusion

Over the last decade, many CRM projects relied on integrating and migrating data from ERP and other systems of record in order to provide useful information for sales, service and marketing users. But CRM systems are not well-suited to also serve as data warehouses, even if that is how they have often been deployed. I foresee a time in the not-too-distant future when Customer Insights replaces a lot of this complex, heavy data moving work that currently goes into CRM deployments. The holy grail of getting the “true” picture of your customer and leveraging that for intelligent business may not be so far off after all.

%d bloggers like this: